Consolidating Reporting
Running reports is a key daily activity for most roles in the Ad Tech industry. With the number of corporate acquisitions Yahoo has had over the years, you can only imagine the number of reporting platforms and backend systems that were available to employees. Consolidation was needed to optimize workflows and reduce redundant and costly external tools.

THE SETTING
Each time a new company was acquired, Yahoo inherited a new technology platform and accompanying reporting system. Despite numerous consolidations and migrations, there was no single source of data truth in the company. On top of this, expensive external analytics tools were purchased to fill the numerous gaps in the inadequate Reporting platforms available in-house.
Users were understandably frustrated. The main reporting tool was confusing, lacked guidance, and had very low user satisfaction scores. Yet employees were told they must use it. For the most part, they didn’t really have any other choice.
THE CHARACTERS
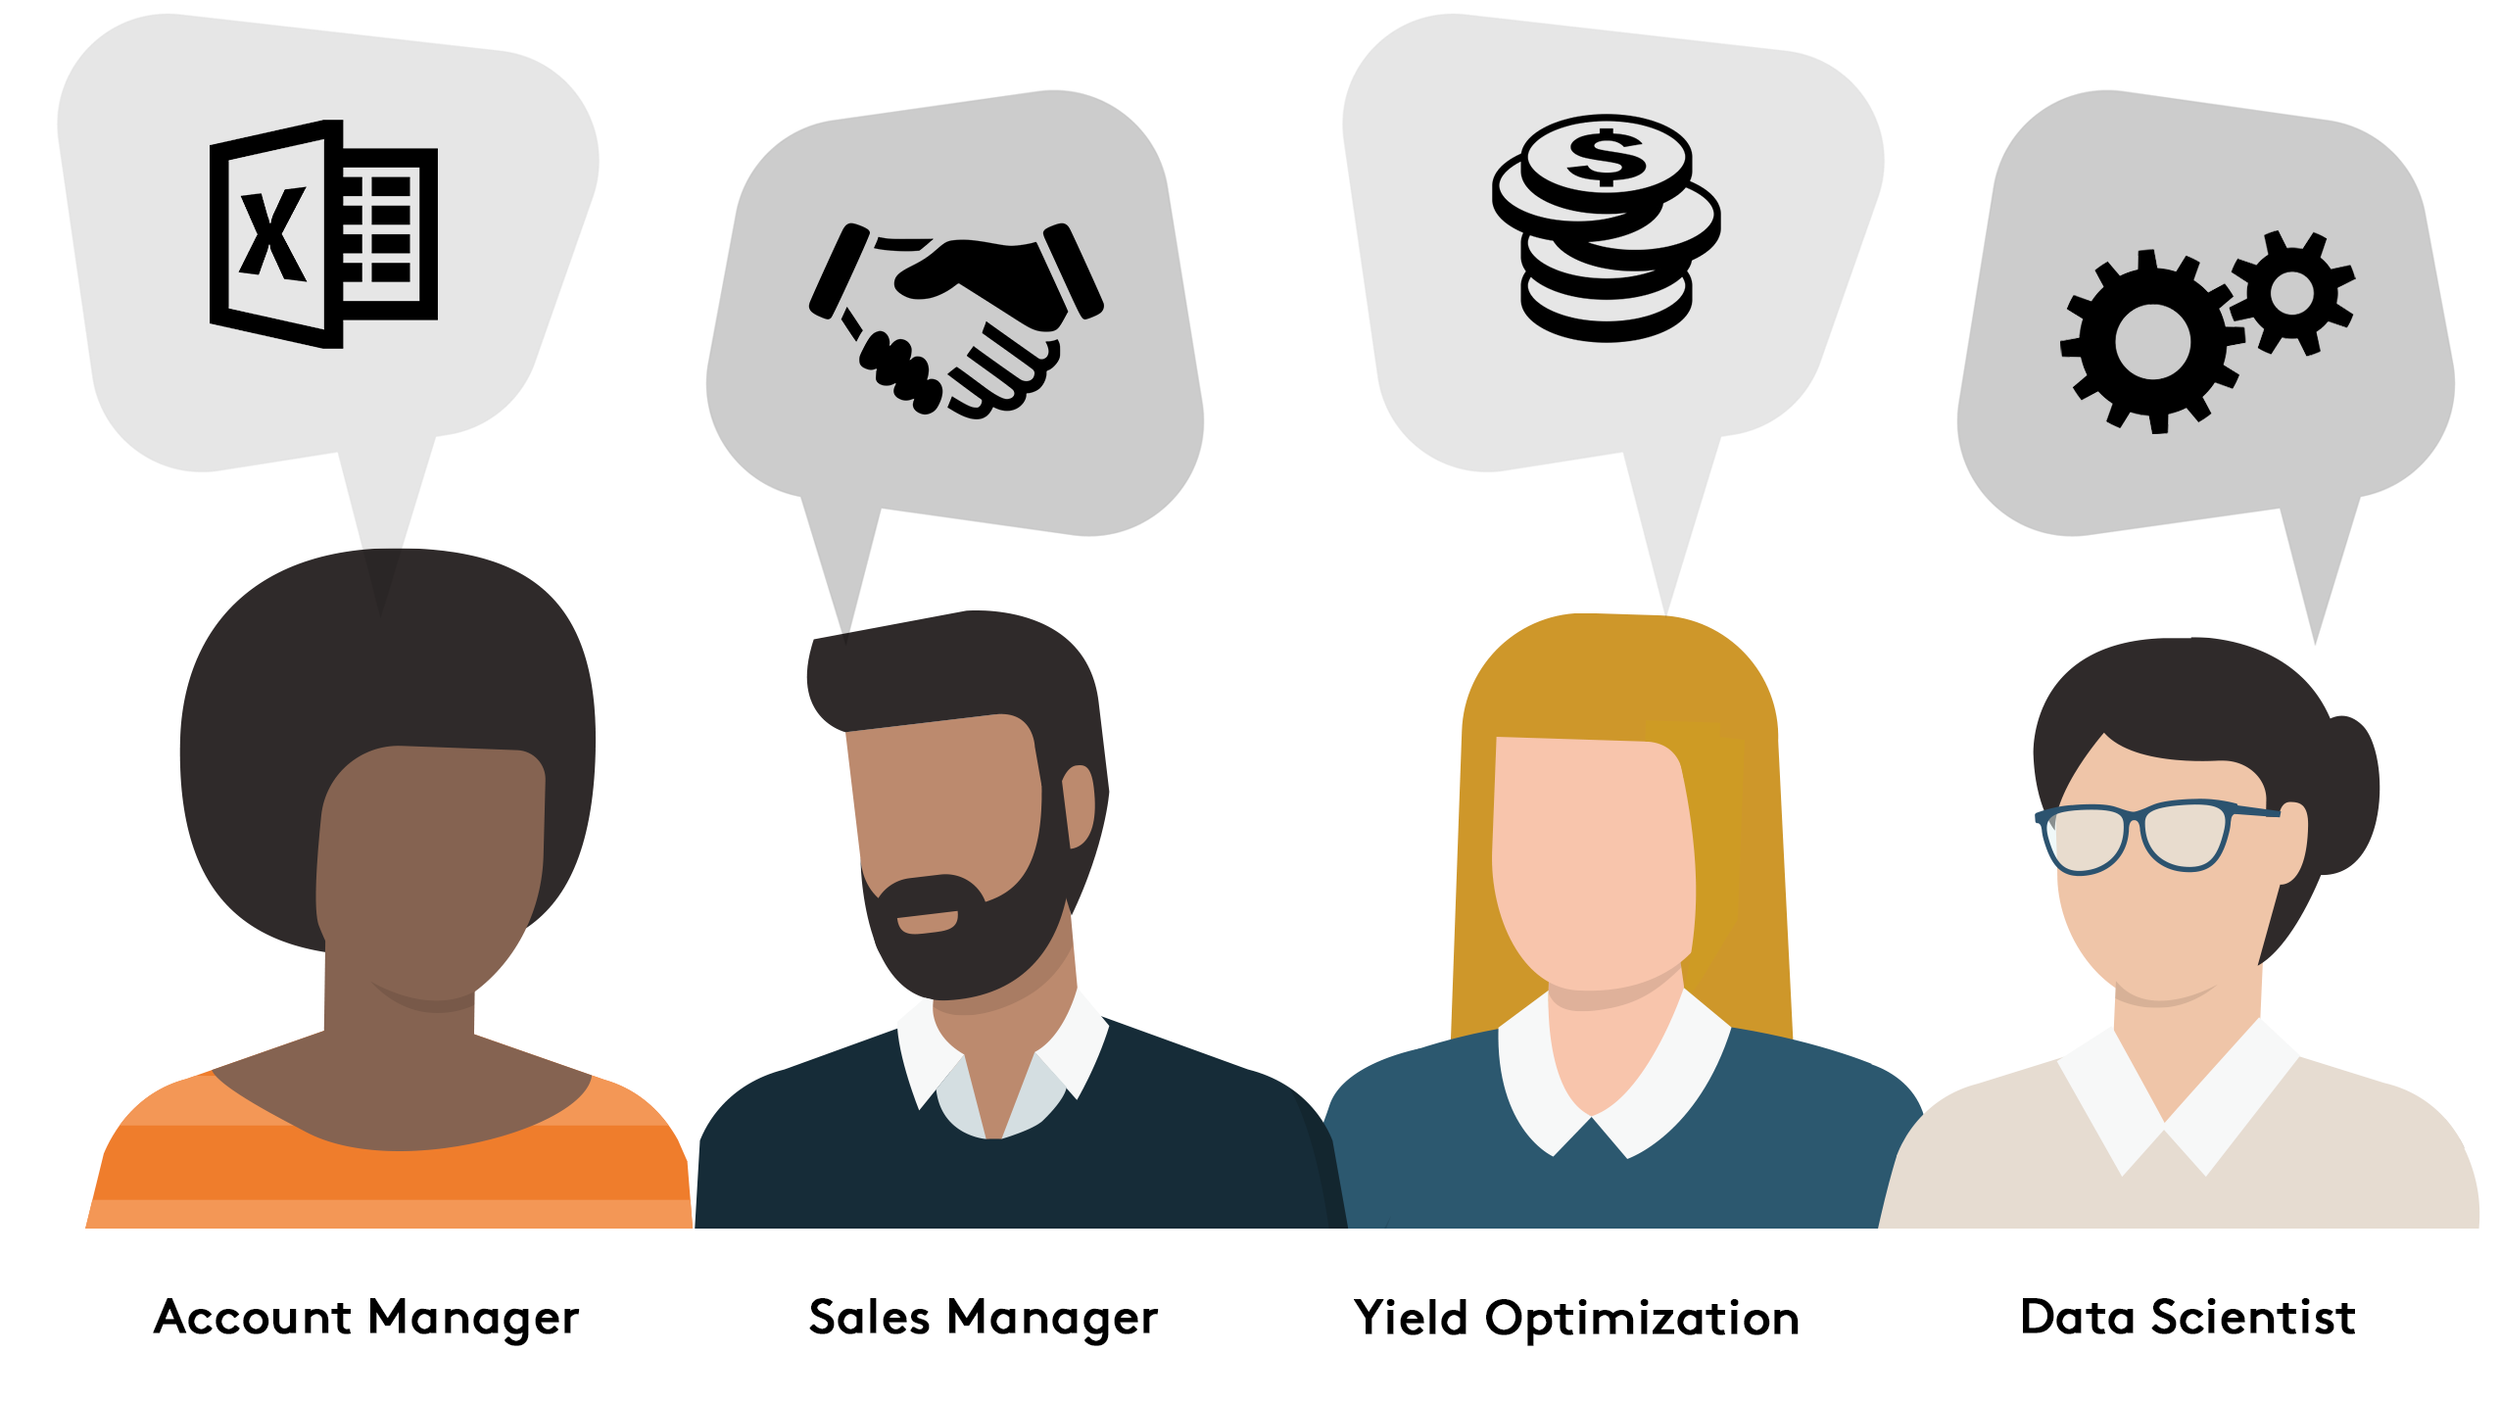
Roughly 4,000 users visit the Reporting tool daily and run over 500k queries per day. These users come from all across the Business and Ad Tech orgs within Yahoo as well as Third Party Publishers and Advertisers. The main user personas are:
Account Managers
Sales Managers
Yield Optimization
Data Scientists
THE CONFLICT
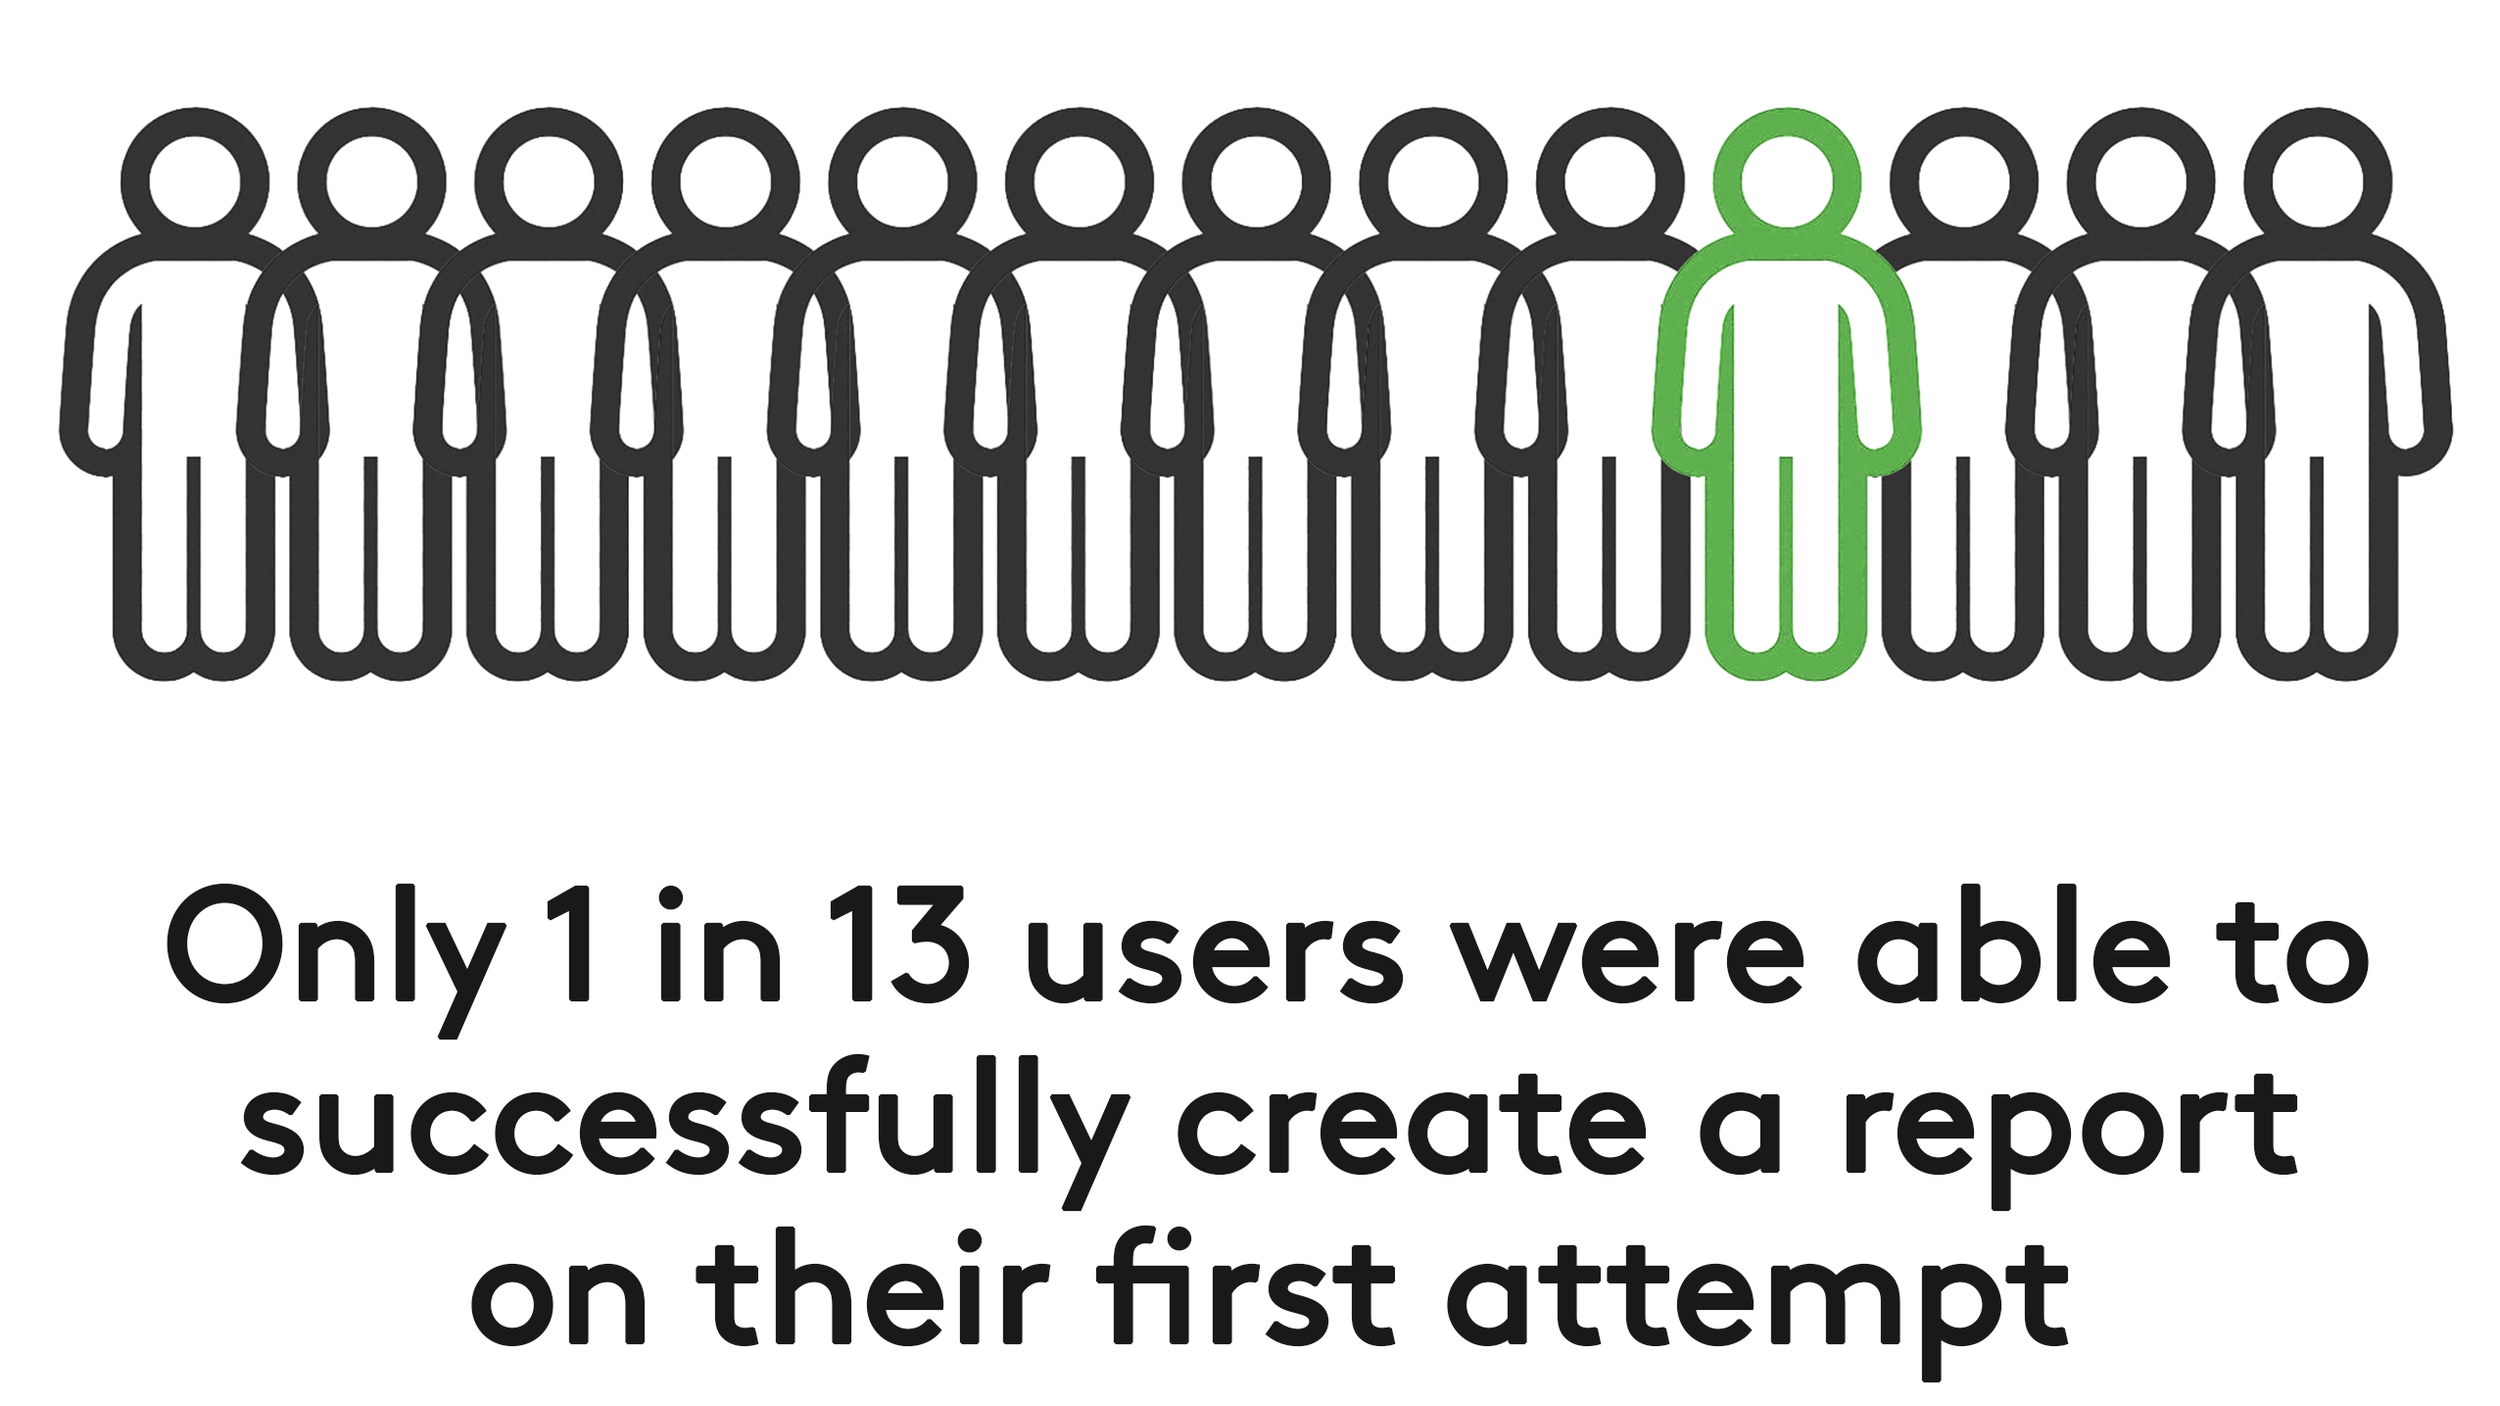
Users were frustrated with the pressure to use latency-filled internal reporting platforms that were buggy and confusing. An extensive UXR study concluded that only 1 in 13 users were able to successfully create a report on their first attempt using the main legacy reporting tool.
This legacy tool supported 15 distinct platforms, each with a unique user segment and very specific usage requirements. The system was overloaded, filled with bugs and feature gaps, and came with an intolerable latency problem that would keep users waiting for minutes to hours depending upon the single reporting queue backlog. Help documentation was outdate if it existed at all, and there was no in-platform contextual help or data insight.
THE BIG IDEA
Performing a complete UX/UI overhaul of the reporting platform was determined to be the best course of action. Reporting 2.0 kicked off in 2020 promising to be a completely redesigned Analytics/Reporting experience.
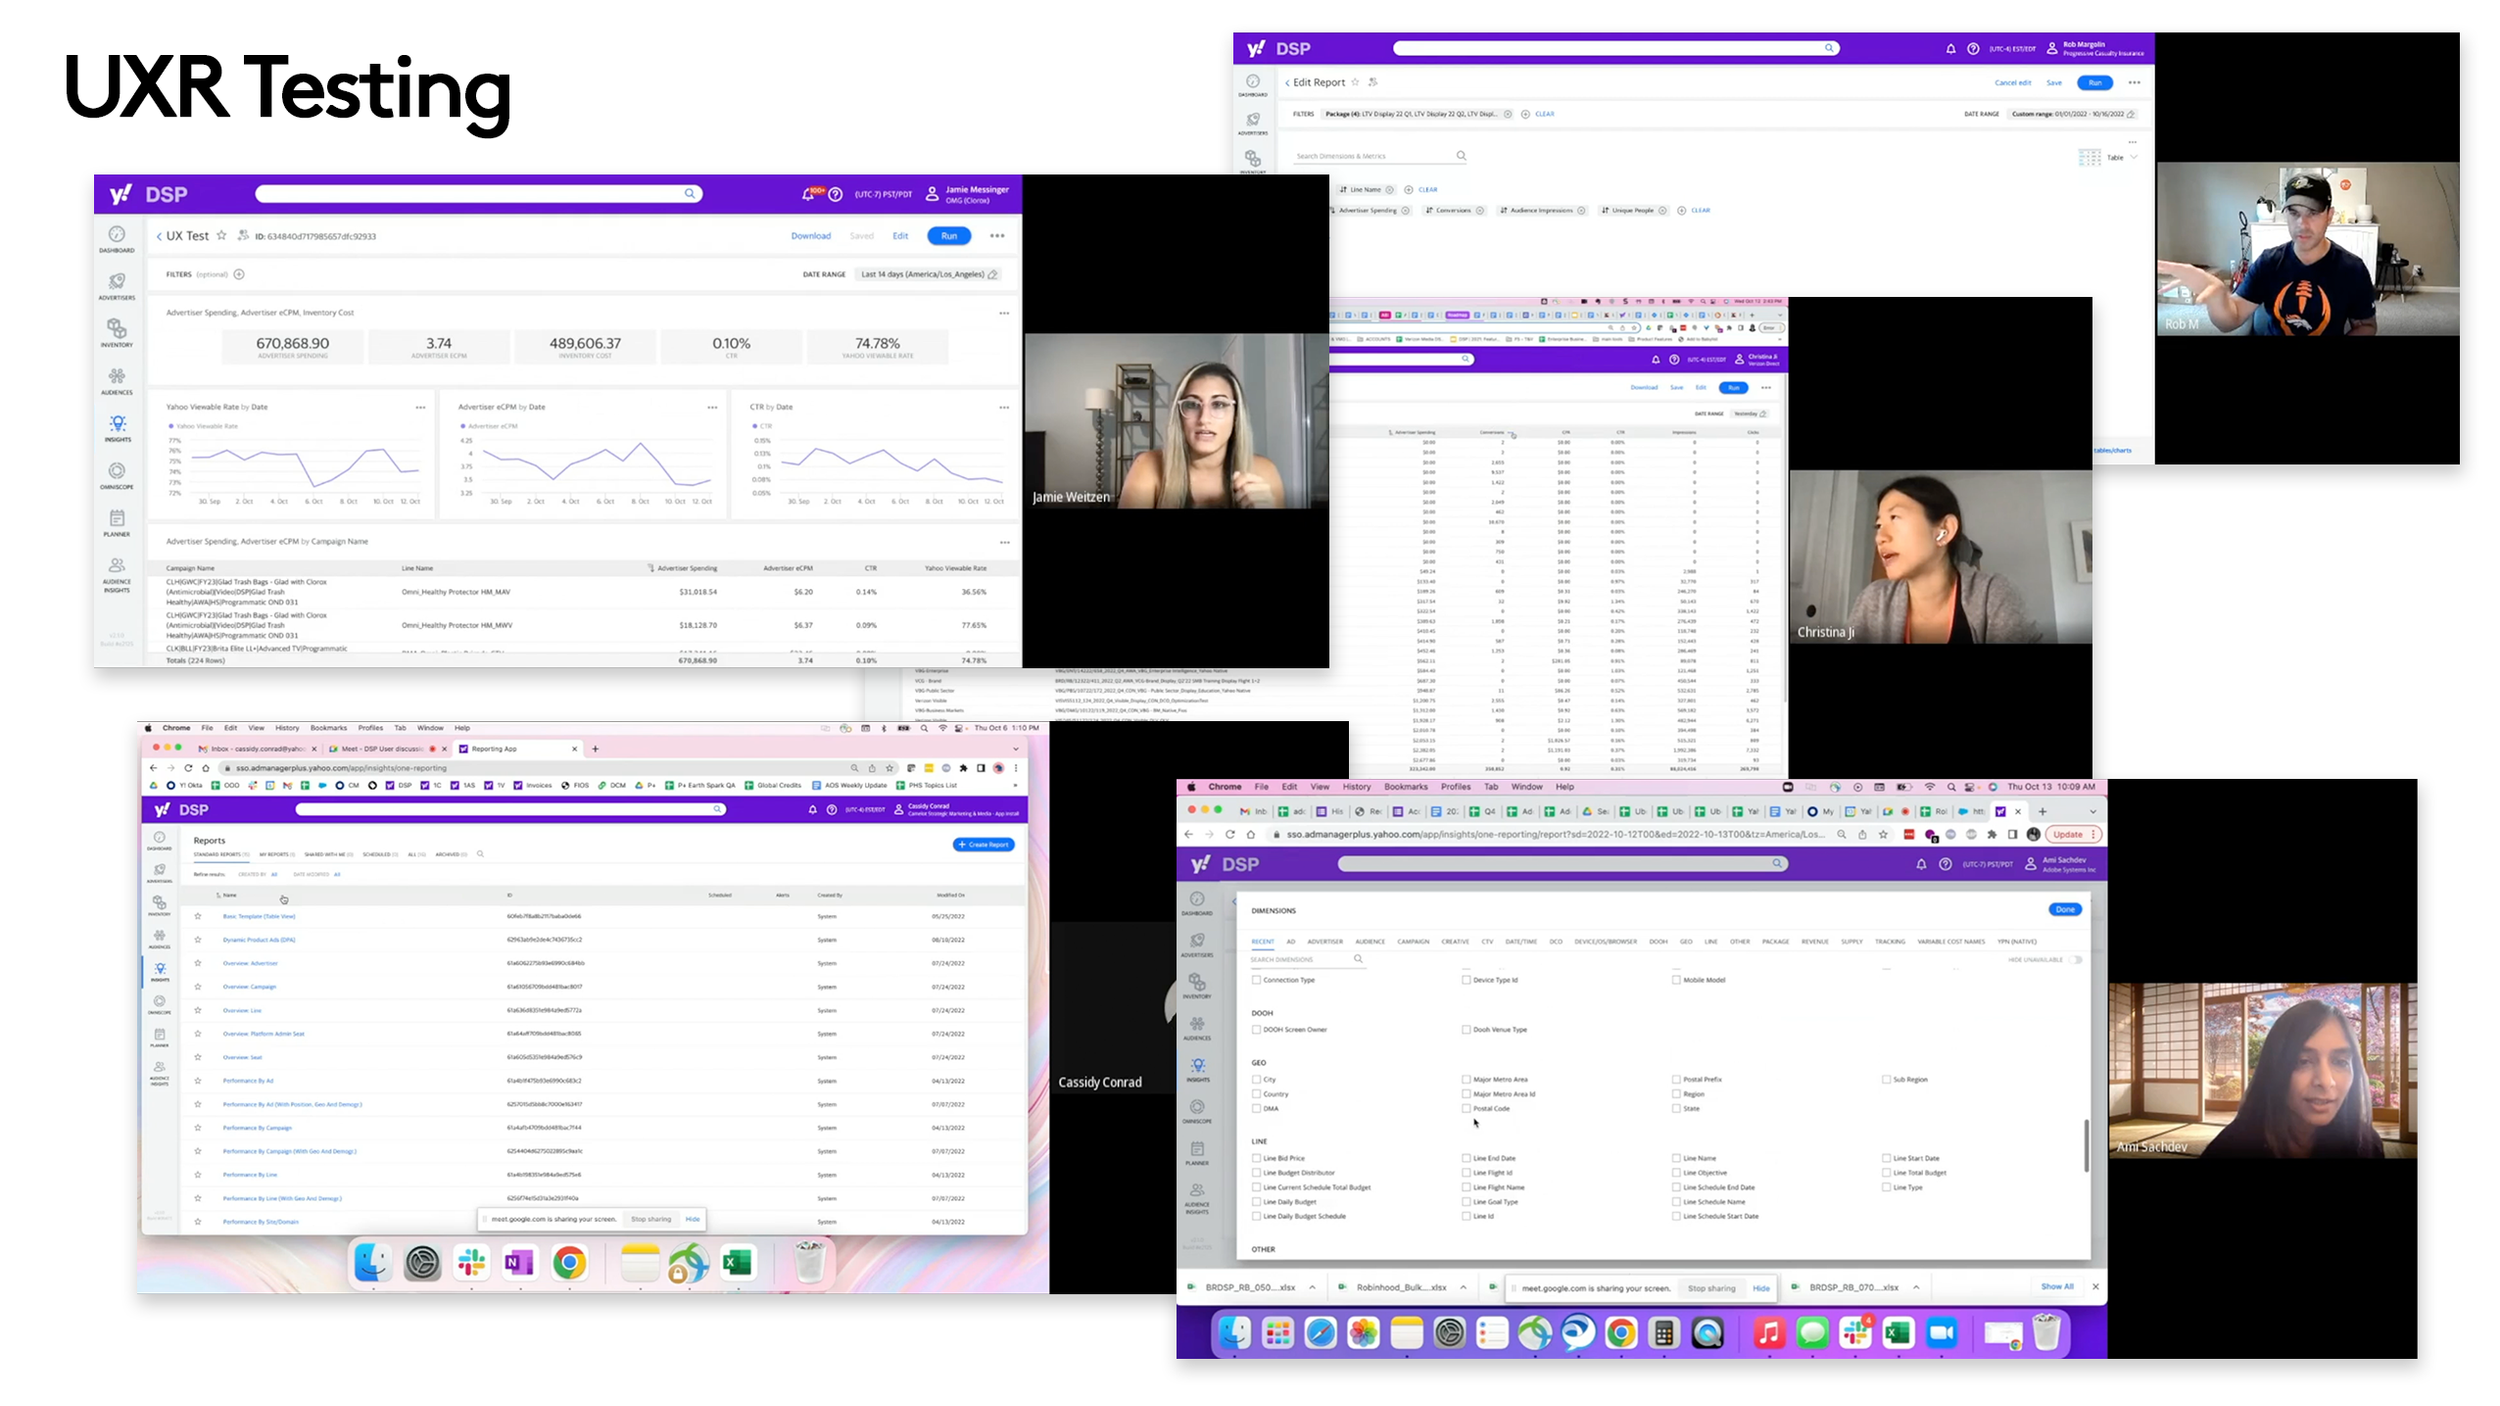
Several extensive UXR studies were conducted with Reporting users. The Business, Product, UX and Engineering teams then met at numerous off-site summits to develop a vision of creating a single reporting and analytics platform. The goal was to replace the current disparate systems and to build in the missing features that were leading to the use of external platforms. With this new tool, the company would have a centralized and effective way to handle all reporting and analytics needs.
THE RESOLUTION
It was determined that the Publisher platforms would require the lowest level of effort for the engineering team tasked with overhauling the legacy reporting platform. This was a multi-quarter project that continues to innovate and expand features sets to this day.
Because the tool would be accessed not only by the SSP users, but also the Ad Server teams, account teams and external customers not using our SSP, the Reporting tool needed to be a stand-alone platform as well as integrated into the SSP. Adherence to our Design System allowed the tool to be essentially i-framed into the SSP without looking like a foreign element.
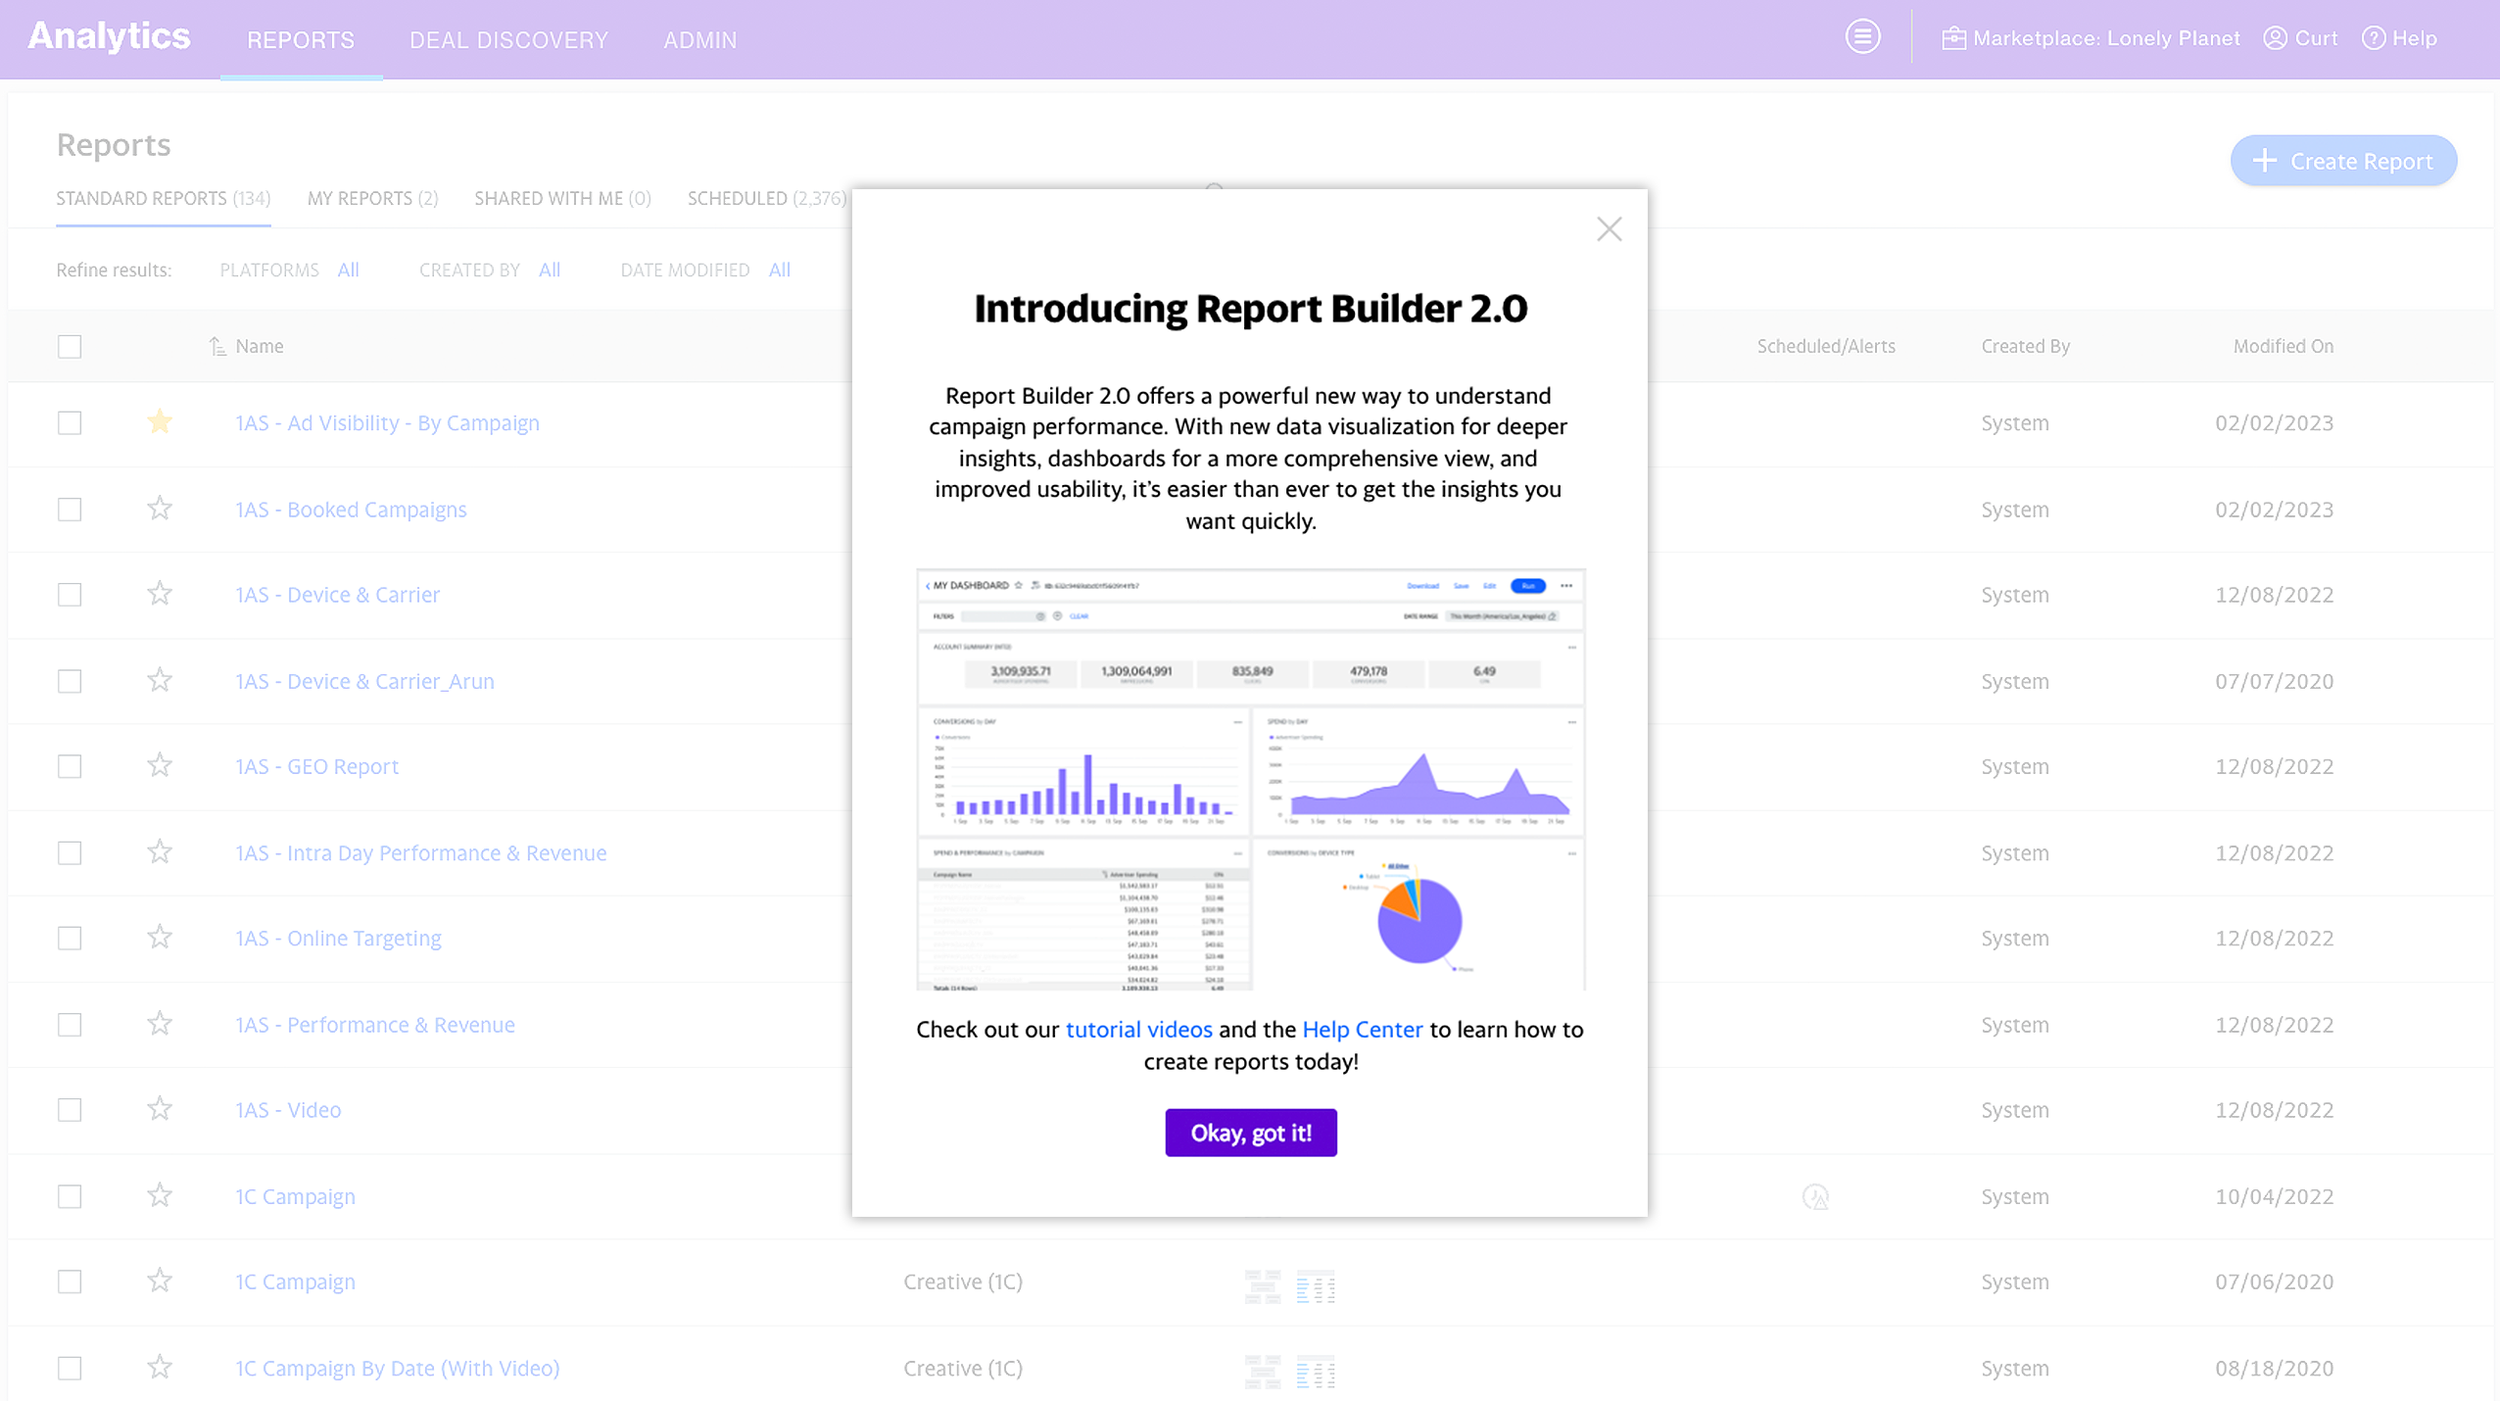
New features included robust permissioning, new data viz, a reporting API, custom reports and scheduled reports.

THE RESULTS
Once launched into Beta the following year, there was a 30% reduction in time spent on the platform indicating an increase in speed and ease of use. 43% of users adopted the platform during the beta roll-out and didn’t return the the legacy tool.
The help documentation was refreshed and included video walk-thrus generated by the Product team themselves. The success of the GA release the following quarter led to the adoption of the tool by the DSP that replaced their in-platform analytics with Reports 2.0.
Future follow-up UXR studies are scheduled to compare earlier benchmarking metrics such as the report creation success rate mentioned above. The expectation is a complete reversal of the statistic.